This project involves sports analytics. I have a profound interest in sports like soccer, basketball and mixed martial arts. This project specifically focuses on soccer and uses bayesian methods to analyse and model the data.
This project dives deeper into analyzing the different tactical styles teams use throughout any given season of the english premier league and how that effects the final league table position of a team.
Since no teams publically announce their tactical style, the proxy for the tactical style could be the stats generated by a team in a season. First let’s introduce the data and motivation for the project and then I can dive deeper into how the tactical styles were inferred using the stats.
Data
The data used for this project covers the 2006-07 till the 2017-18 season in the English Premier league. This data was acquired through Kaggle
Motivation
The motivation to undertake this project stemmed from the fact that certain tactical styles are dominant and help teams finisher high in the final standings. Albeit the players who execute the tactical styles are extremely important, more often than not it has been observed that just building up a team with high quality players is never enough for the team to perform well. The coaches and their tactical strategies play a big role in a team’s success. That is why often when a team isn’t doing well and a new manager comes in, there are changes to the tactical styles and the team either does better or worse, depending on the prowess of the tactical style.
Hence, there is a need to understand which tactical styles do impact such shifts in positions of teams from one year to the other. That is, to understand the reason for a team to drop/rise in the final standing of the league table from one season to the other. This reason could be attributed to a change in tactical style, which could further be explained by the change in overall stats of the team in a given season.
This analysis could answer questions like: Does the team need to improve passing % and possession to finish higher in the league table? These questions when answered could be the key for coaches to design the training schedule and drills to focus on.
Tactics & Stats
The stats provided in the data needs to be mapped as proxies to different styles of play.
The stats considered in this project and the respective tactical style have been summarized below:
| Statistic | Statistic Category | Tactical Style |
|---|---|---|
| Shots taken | Shots | Attacking play |
| Goals on counter | Goals | Counter Attacking play |
| Goals conceded | Goals | Offense only play |
| Goals from outside the box | Shots | Shooting on sight / Attacking play |
| Long balls | Possession / Build-up | Visionary Attacking play |
| Passes | Possession / Build-up | Possession play |
| Crosses | Width / Build-up | Wing play |
| Through balls | Width / Build-up | Visionary play |
| Bookings | Defense | Aggressive / Physical play |
Given these statistics in the data set and understanding the tactical play which the players can implement based on their skill could make or break a team. So a coaching staff would benefit a lot using this kind of data not only to train the players better but to also make the right choices in the transfer market.
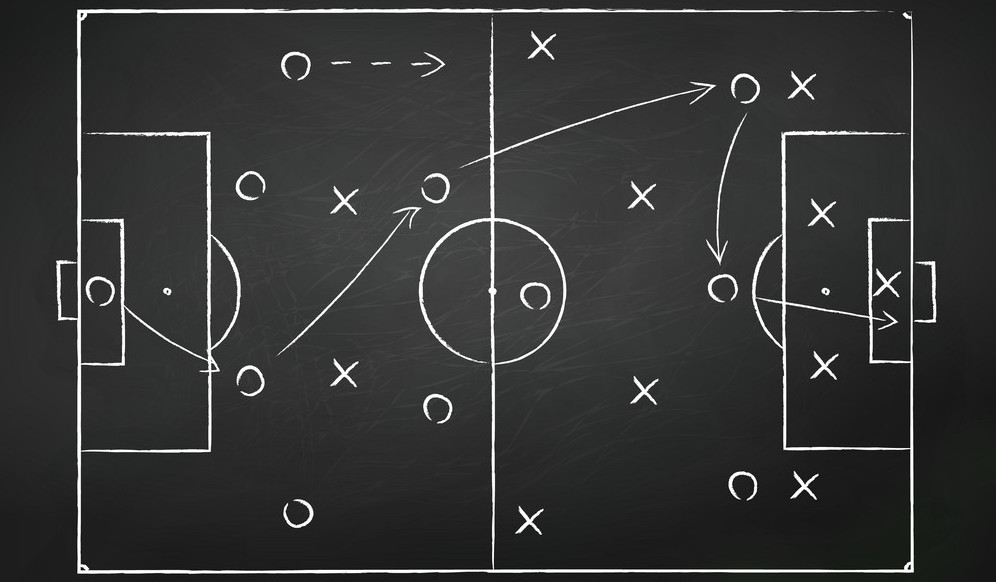
Let’s look at what some of these plays look like.
Wing Play

Counter Attacking Play

Possession Play

Data Wrangling
First, the positions in the league table were divided into 4 classes:
- Champions League Qualification (top 4 teams)
- Top half (teams #5 to #10)
- Bottom half (teams #11 to #17)
- Relegation zone (bottom 3 teams)
For each season, each team would be assigned a standing class based on where they ended up in that particular season. The next thing was to obtain the shifts in standing classes for each team from one season to the other based on the following convention:
- If a team stayed in the same standing class as the previous season - Label: 0
- If a team moved to any of the higher standing classes - Label: +1
- If a team moved to any of the lower standing classes - Label: -1
This shift in standing class will serve as the response variable.
The difference in combined stats for a team from one season to another was also captured. This means that if a team had the value +3 for the column ‘goals’ then they scored 3 more goals in the current season as compared to the previous season. This delta for each of the stats helps capture how the tactical styles may or may not have changed over the last season.
Other than the features given in the table above, another feature used was the standing class in the previous season. This was done because a team going from the bottom half to Champions League Qualification has a significant tactical change as compared to a Top Half team going to the Champions League Qualification standing class.
Models
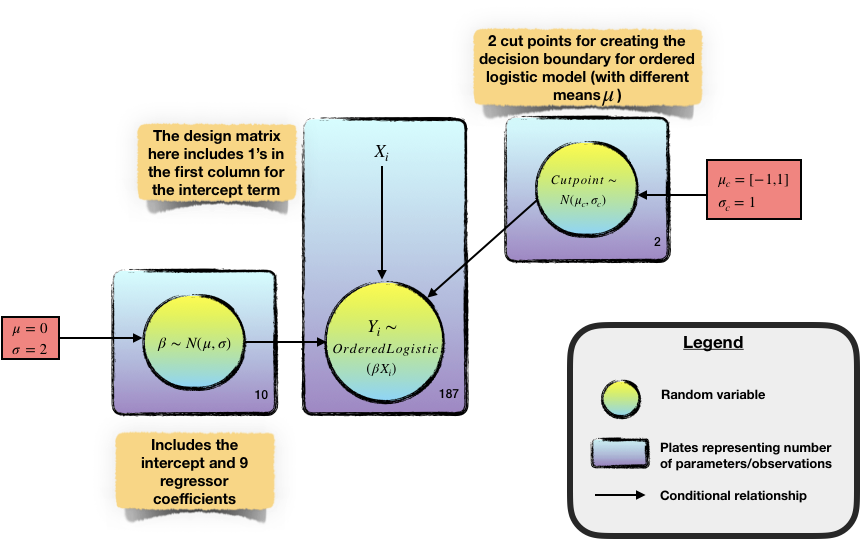
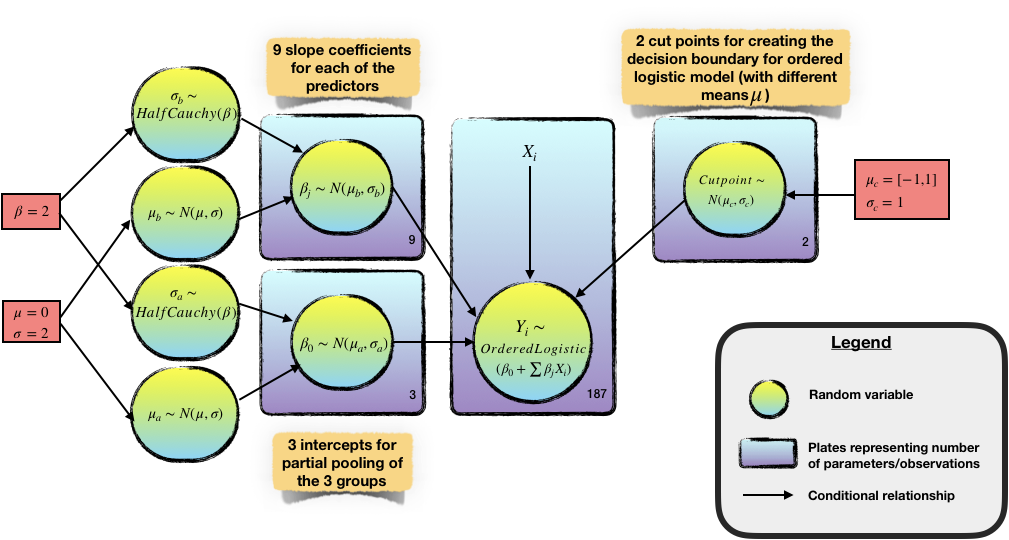
Using the 10 features and the response variable, three different models were tested using a Bayesian Ordered Logistic Model from the PyMC3 package:
- Complete pooling model using an Ordered Logistic Regression with 9 features
- Complete pooling model using an Ordered Logistic Regression with 9 features and all possible interaction terms amongst those 9 features
(same figure as above except it contains all possible combinations of the 9 features)
- Partial pooling model (Hierarchical model) by providing a distribution for the priors of the priors of the final model, i.e each prior of the final model will have its own set of priors defined
Model Selection
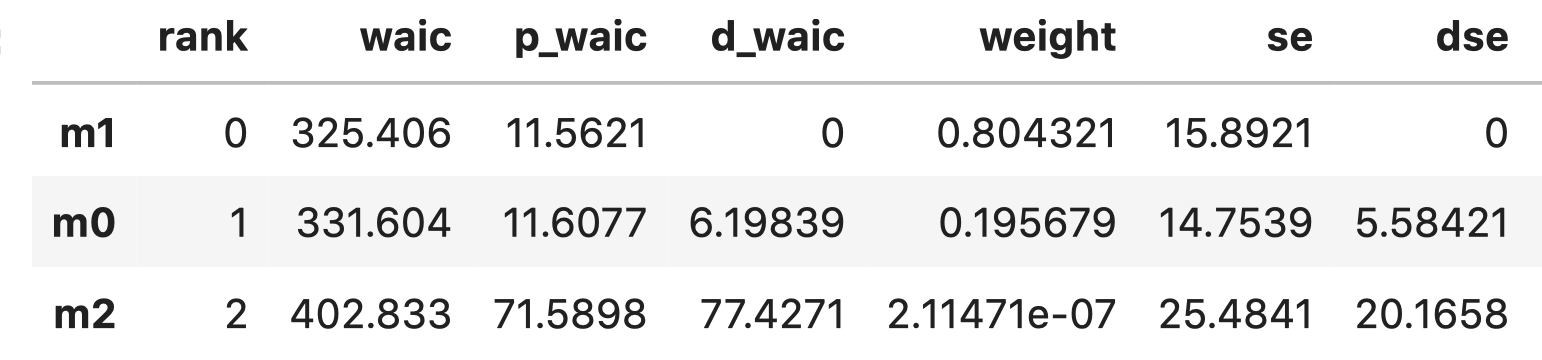
WAIC was used to select amongst the three models:
 Where,
m0: Complete pooling model
m1: Hierarchical model
m2: Complete pooling model with interaction terms
Results
Using the hierarchical model, the coefficients had the following posterior distributions:
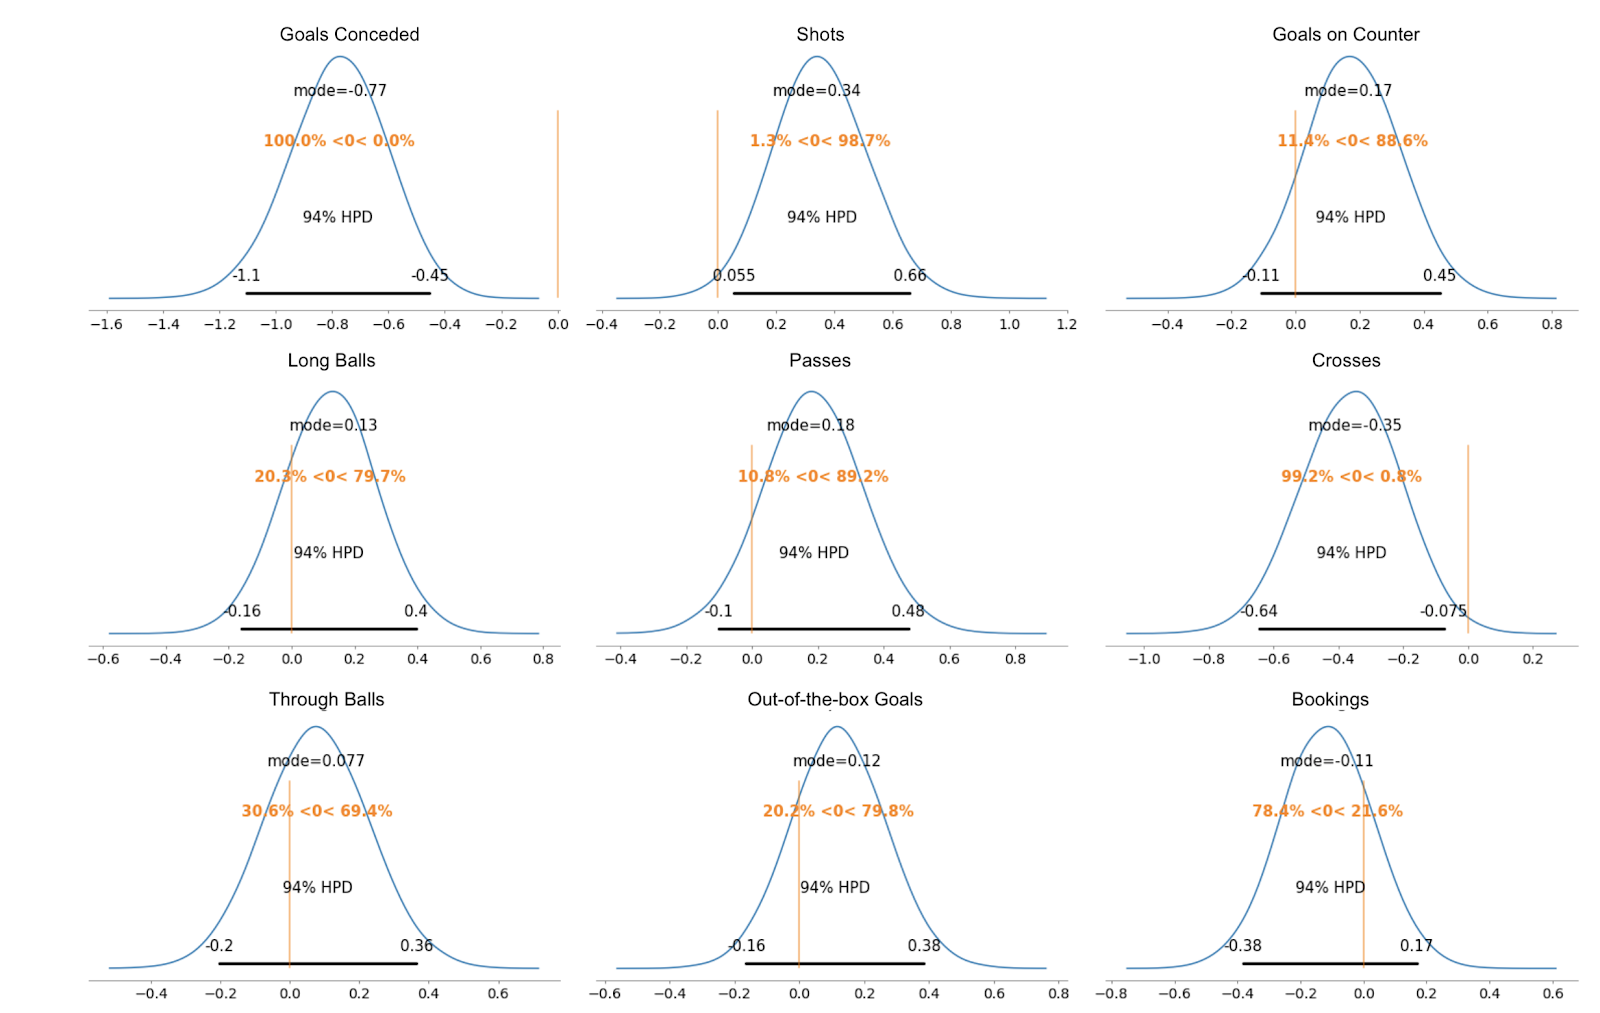
Only 3 features turned out to be significant:
-
goals conceded: -ve coefficient
if a team concedes more goals as compared to the last season, the team might finish in a lower standing class, this shows that keeping clean sheets is an important thing for coaches to consider while devising strategies -
Shots: +ve coefficient
if a team takes more shots as compared to the last season irrespective of it converting into a goal, the team might finish in a higher standing class, this shows that teams that usually have an aggressive style of play with more shots taken usually end up doing better. -
Crosses: -ve coefficient
if a team crosses more than it did last season, the team might finish in a lower standing class, this was one of the most interesting finds as it suggests that crossing hurts a team more than it benefits. Crosses are usually considered an aggressive tactic and is quite a technical move. However, based on the data and model it seems to be the other way round.
This finding related to crosses was later found to be the case in Manchester City’s poor performances in late 2019.
Article link
This analysis shows that a lot of insights could be generated using very simple forms of data. By using much more complex forms of data, these modeling techniques could turn out to be extremely useful for sports teams. It also proves that Bayesian analysis performs well in cases where one needs to model some form of uncertainty.
You can check the entire project here